
Taxis and Rideshares in NYC
New York City is lively and bustling with locals, tourists, workers, and many more. Each month, tens of millions of people use taxis or rideshares. Through this editorial, we'll be exploring the use of these modes of transportation throughout New York City. We specifically investigate the use of yellow taxis, green taxis, Ubers, and Lyfts in a random sample of 10,000 rides during the month of July 2021.
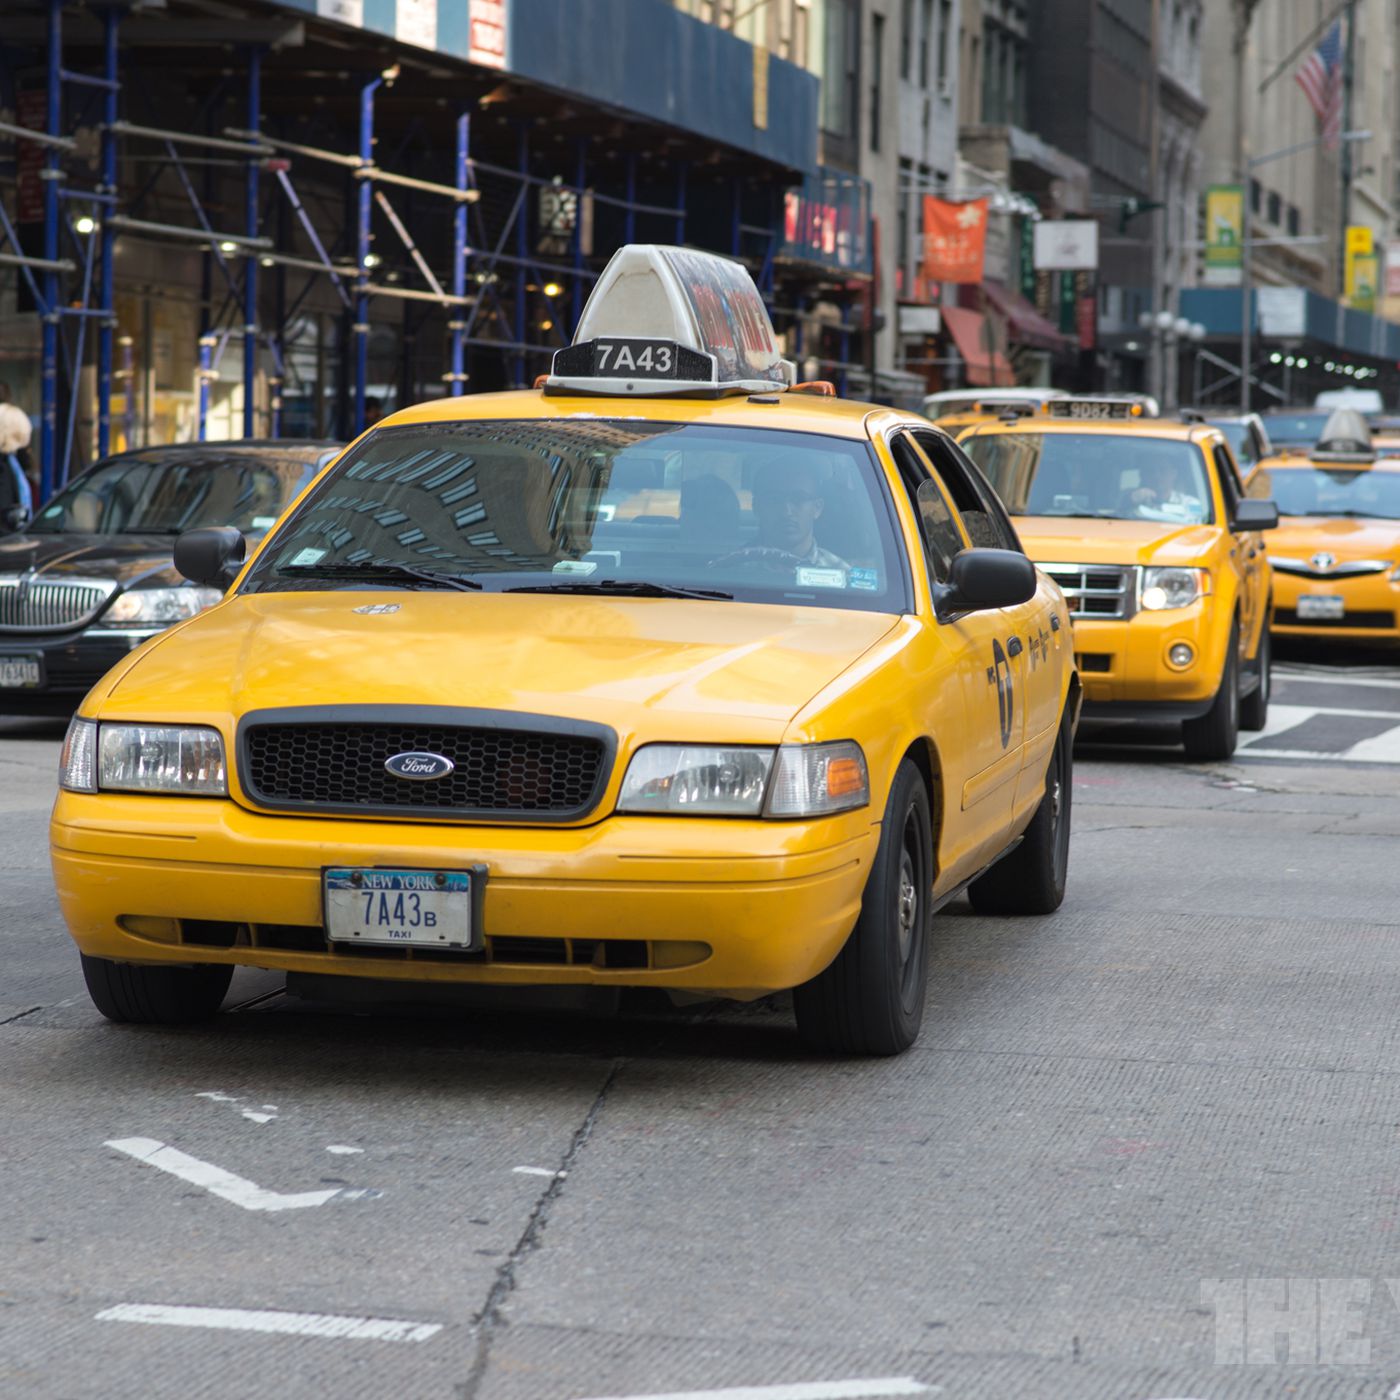
Yellow taxis are the most common form of taxi in NYC and are probably what comes to mind when you think of a NYC taxi. These taxis are the only vehicles allowed to pick up passengers anywhere in New York City.
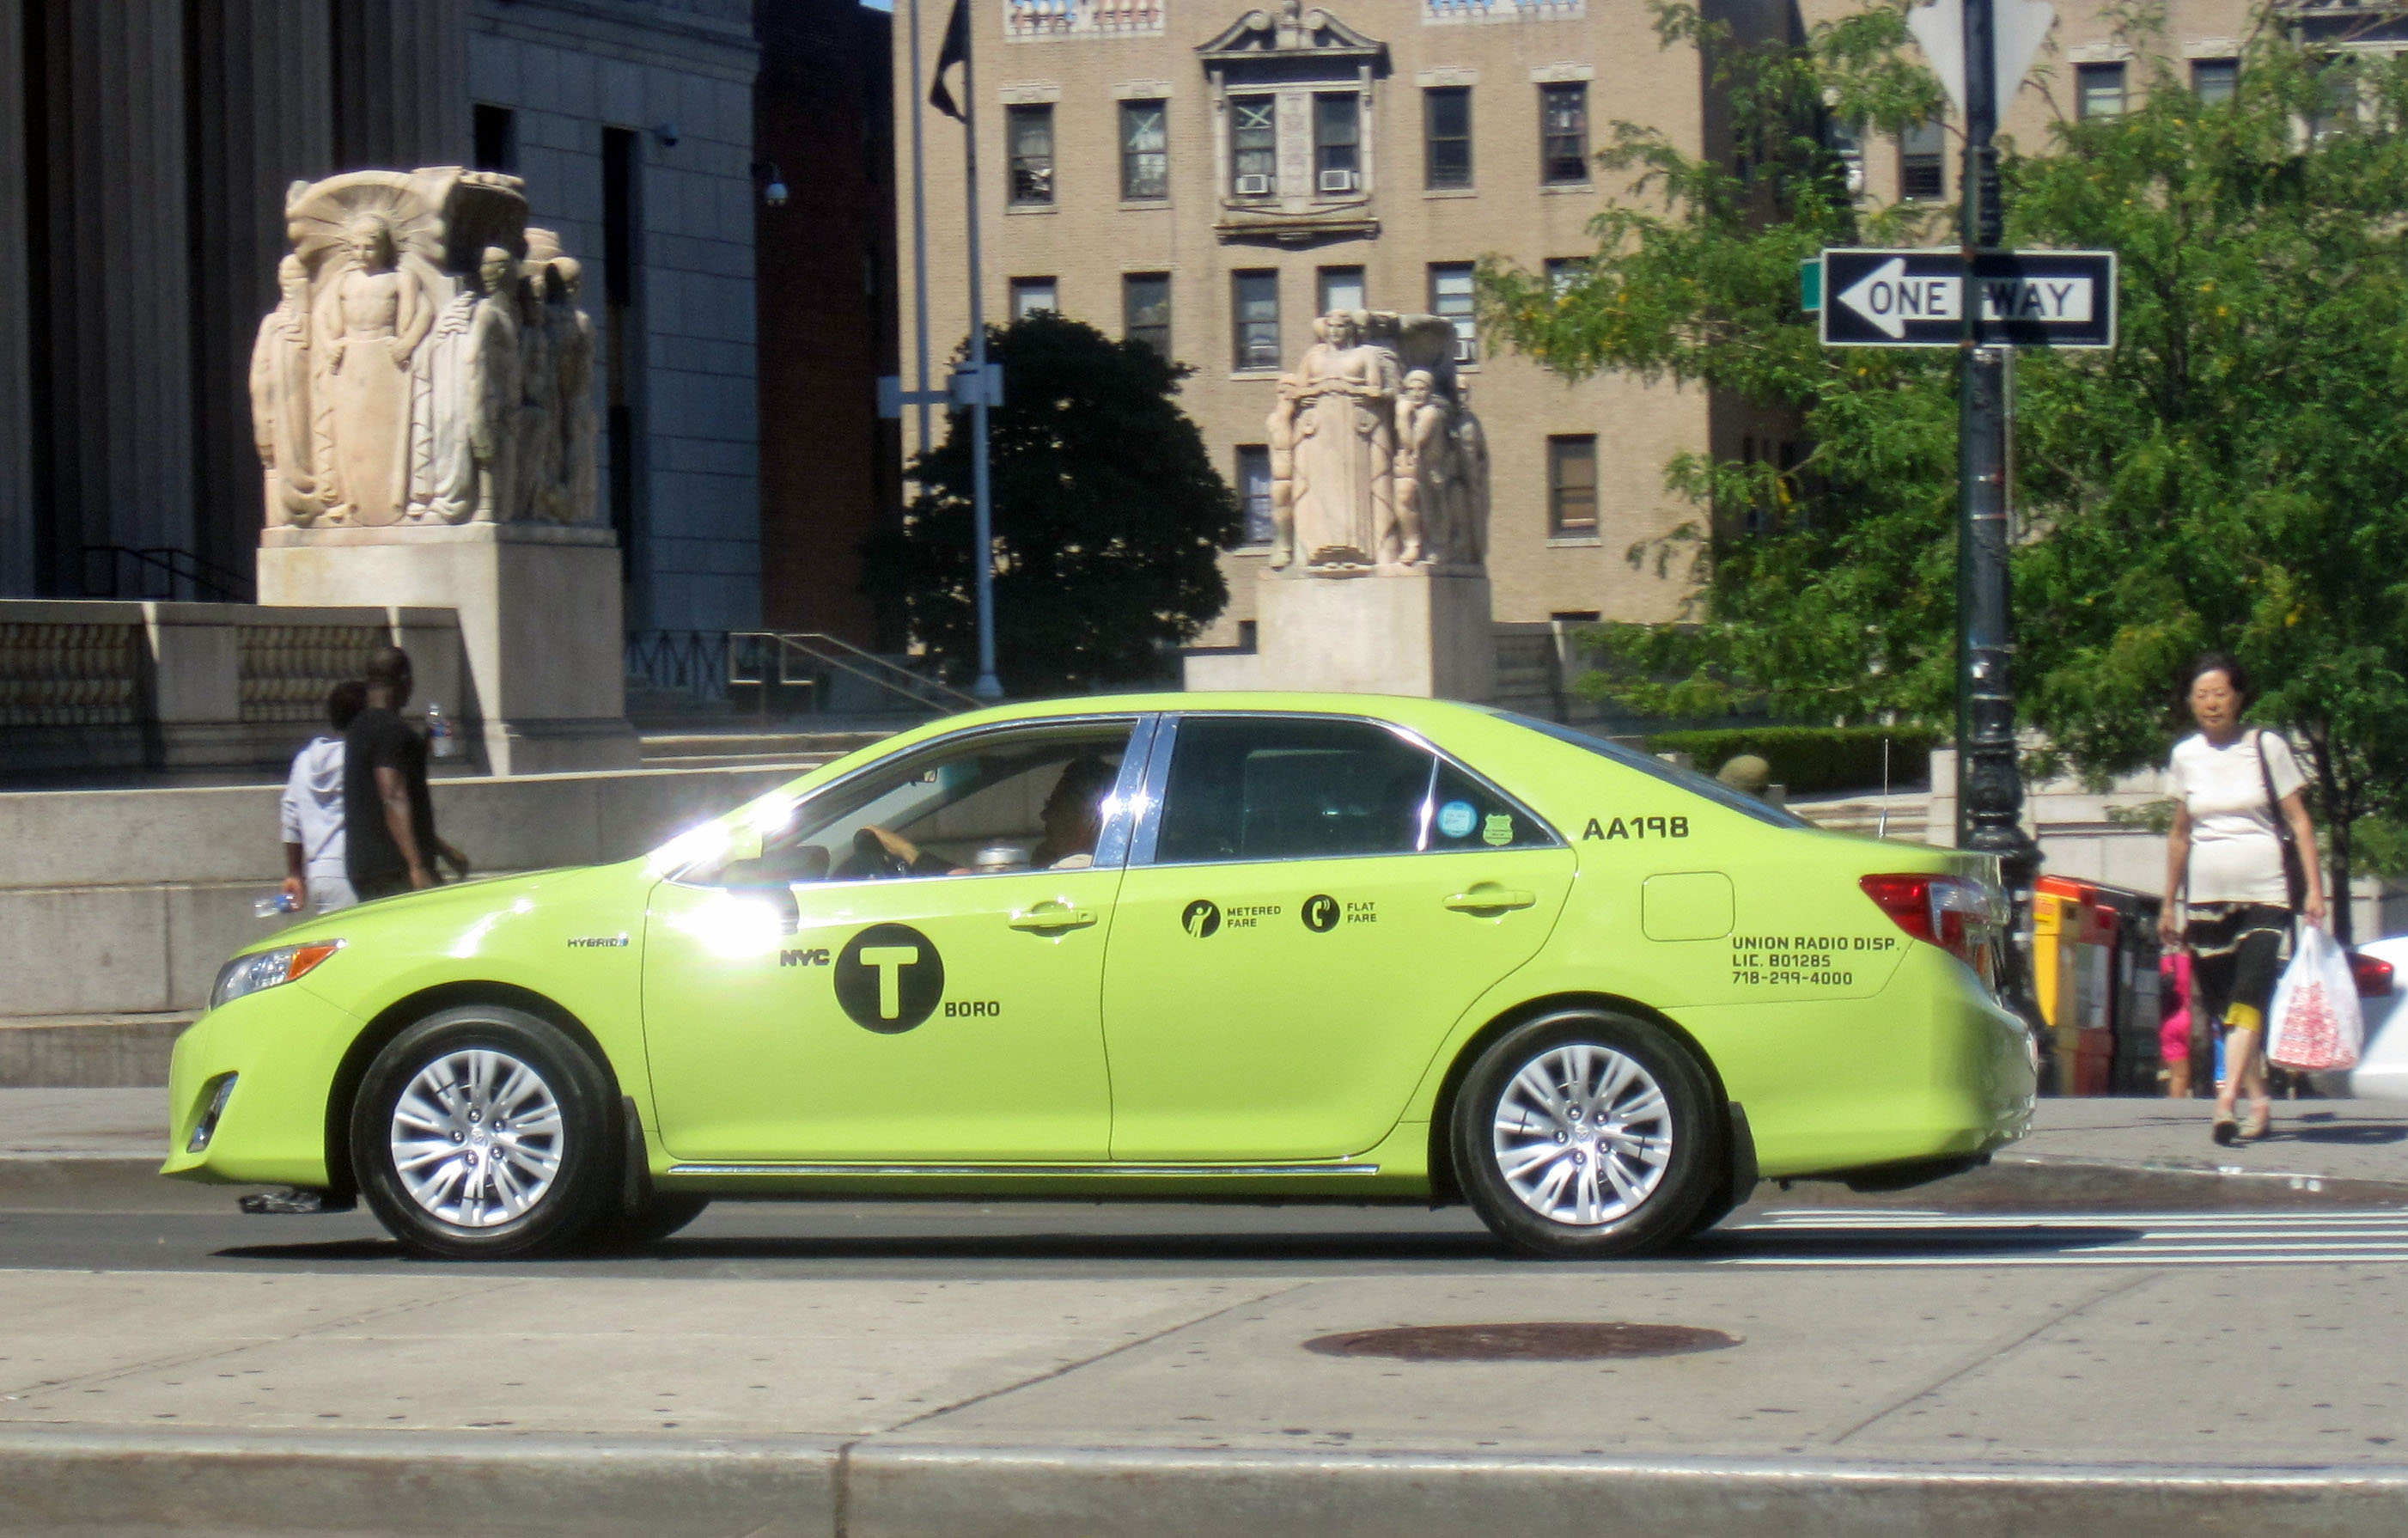 In 2013, green taxis were introduced to the city to improve coverage in areas underserved
by yellow yaxis. Specifically, green taxis can only be hailed in the Bronx, Brooklyn, Queens, Staten Island, and
Northern Manhattan. There are no restrictions on where passengers can be dropped off.
In 2013, green taxis were introduced to the city to improve coverage in areas underserved
by yellow yaxis. Specifically, green taxis can only be hailed in the Bronx, Brooklyn, Queens, Staten Island, and
Northern Manhattan. There are no restrictions on where passengers can be dropped off.
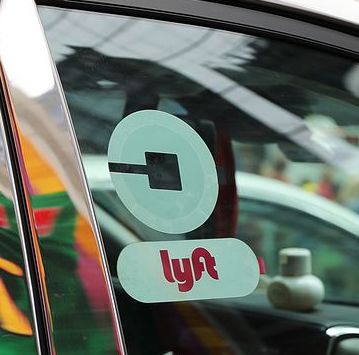 Ubers and Lyfts are relatively new to the city. Ubers rose to prominence in 2017, when
they began to surpass the amount of yellow taxi rides. This rise was facilitated by higher use in outer boroughs,
since they were still underserved by yellow and green taxis. Lyft launched in NYC in 2014 and has trailed Uber's
presence since.
Ubers and Lyfts are relatively new to the city. Ubers rose to prominence in 2017, when
they began to surpass the amount of yellow taxi rides. This rise was facilitated by higher use in outer boroughs,
since they were still underserved by yellow and green taxis. Lyft launched in NYC in 2014 and has trailed Uber's
presence since.
There is a wide distribution of when and where taxis and rideshares are used throughout NYC. Depending on where
you are
and when you're using them, the price can vary, and there are even differences in how people tip.
Use this map to explore how the different modes of transportation are used throughout the city and gather insights
on the most popular pick-up and drop-off locations and times or how much your ride might cost!
Note: There is no price/tip data available for Uber and Lyft.
Overall, JFK Airport is the busiest pickup and dropoff area. We found this interesting
because Laguardia Airport is closer to Manhattan which is another busy
pickup and dropoff area. After researching, we found that JFK airport
services international flights unlike Laguardia Airport.
From 12AM-6AM, the busiest pickup area is East Village which is expected
as East Village is known for its nightlife. From 6AM-12PM, the busiest
dropoff area is Midtown Center which is where many large corporations
have their offices and is central to many of New York's tourist attractions.
The most popular modes of transportation are Uber and Lyft in comparison to yellow and green taxis. This may be due to Uber and Lyft having a convenient mobile platform to hail your next ride at any time.
One of the most expensive areas to be dropped off at is Newark Airport for an average price of $121.86. This may be due to many tolls that it takes to get from New York to New Jersey. Two of the most expensive areas to be picked up at are JFK Airport and Long Island City. Since many of the busy dropoff areas are in Manhattan, it makes sense that traveling from boroughs outside Manhattan into Manhattan would be expensive.
People in NYC are always on the move. In the following chord diagram, look at how different transportation routes function as a whole. We noticed many interesting patterns within this chord diagram and developed three different presets to showcase popular pickup and dropoff routes. Interested in seeing where people travel to from a certain area? Apply different filters to narrow down the areas shown and examine the flow of ride hails through each borough. Hover over your desired pickup location to get more specific details about it. Feel free to explore all of the different filters to learn more about the areas that interest you!
This chord diagram allows for a deeper dive into the aforementioned trends. We have highlighted 3 specific groups of interest below.
Hover over a zone to see its name and more details.
Here we investigate what factors may cause riders to tip more. The amount of passengers riding, trip distance, and total price all seem like they would play a large role in how riders decide to tip. Tip amount could be used as a proxy for customer satisfaction, although we must be aware of the socioeconomic differences of riders that may affect how much they tip. The bar graphs below show the average percent tip as each factor increases. It seems that the happiest customers are those who ride with 4 passengers, have a trip distance of about 20 miles, and a higher total price.
We can see that percent tip generally increases with the amount of passengers. This makes sense because riders are probably more likely to tip more if they have a lot of people in the car because they can split the tip between them. They may also want to express their gratitude to the driver for being able to accomodate all of them.
There is no clear relationship between trip distance and percent tip. This means that trip distance likely does not have a large effect on how much riders may tip. This may be because riders care more about the quality of their ride, rather than the length.
Total price is a combination of factors such as trip distance, pickup and dropoff location, tolls, traffic, etc. We can see that there is a slight increase in percent tip with increasing total price, but the overall increase is only about 2%. This likely is not very significant.